generation of milk
Has Arrived

Third-party verified by HowGood.

How much greenhouse gas emissions are generated to produce this product?
The production of food and ingredients is a major contributor to climate change. From growing crops to processing and manufacturing, each step releases greenhouse gases into the atmosphere. Cradle-to-manufacturing-gate captures the total impact of producing a product.
Measured as kg CO₂e per kg of product.
| carbon | blue water | land |
|---|---|---|
|
0.048kg CO2e
|
7.07L
|
0.010ha
|
|
dairy
0.415kg CO2e
|
25.95L
|
0.022ha
|

A better milk starts with better choices: ingredients that work harder, processes built smarter, and a product designed to do more with less.
Made to perform where it matters most.
FAQs
Environmental impact data is sourced from HowGood and based on cradle-to-manufacturing-gate lifecycle assessment methodology. This includes emissions, water usage, and land occupation associated with sourcing ingredients, processing, transportation, and manufacturing.
Calculator outputs are generated by scaling those per-kilogram values to the selected product format and quantity.
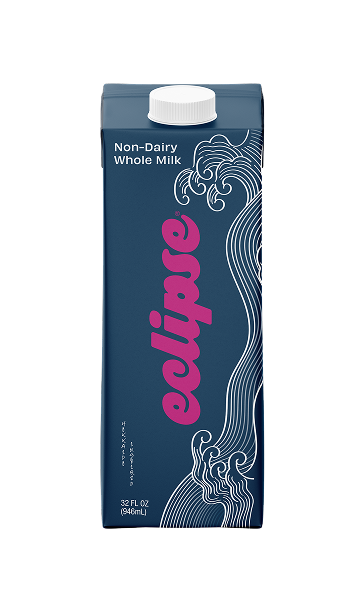
Compared to whole milk, Eclipse Non-Dairy Whole Milk generates up to 88% lower greenhouse gas emissions per kilogram of product based on HowGood lifecycle assessment data.
This comparison uses cradle-to-manufacturing-gate emissions measured in kg CO₂e/kg.
Cradle-to-manufacturing-gate measures the environmental impact of a product from raw material sourcing through manufacturing.
This includes ingredient production, farming, processing, transportation, and manufacturing, but does not include retail, consumer use, or disposal.
Equivalencies are based on publicly available EPA benchmarks and standard unit conversions to help contextualize environmental impact in more familiar terms.
- Miles driven are based on EPA greenhouse gas equivalencies for an average passenger vehicle.
- Showers are based on EPA WaterSense assumptions using an average shower duration of approximately 7–8 minutes.
- Land area uses standard hectare-to-square-foot conversion factors.
Different milk types perform differently across environmental metrics depending on how ingredients are grown and processed.
Eclipse was designed to deliver strong performance across multiple impact categories, including greenhouse gas emissions, water usage, and land occupation.